Image Details
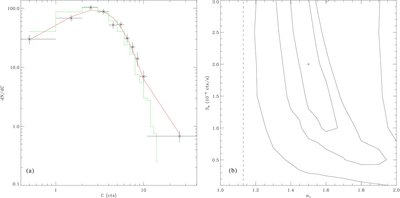
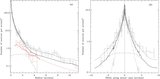
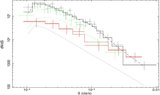
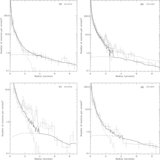
Caption: Figure 8.
(a) Number distribution of source counts for the GCs: crosses: X-ray-undetected GCs; diamond: X-ray-detected GCs with fluxes below the detection completeness limit. The histogram is a representation of the number distribution of local background counts. The curve shows the predicted number distribution from the best-fit model NFR. See the text for details. (b) The 68%, 90%, and 99% confidence contours of the faint-end index and the break flux. The plus sign marks the best-fit values. The vertical dashed line marks the best-fit value of the bright-end index derived from the X-ray-detected GCs.
Other Images in This Article

Copyright and Terms & Conditions
© 2010. The American Astronomical Society. All rights reserved.
Copyright ©
2025 Astronomy Image Explorer. All Rights Reserved.