Image Details
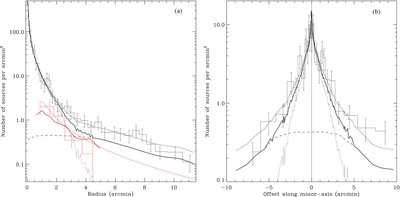
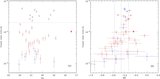
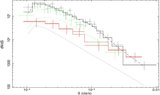
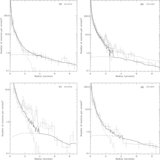
Caption: Figure 6.
(a) Radial surface density distributions of different classes of sources. The histograms (black: field sources; red: GC-LMXBs) are adaptively grouped to have a minimum of 10 sources per bin. The thick black solid curve represents a characterization of the field source distribution, which consists of contributions of field LMXBs (dotted curve; a normalized 2MASS K-band light radial profile) and a cosmic background of AGNs (dashed curve). The normalizations of the LMXB and AGN components are adopted from Gilfanov (2004) and Moretti et al. (2003), respectively. The thin black solid curve consists of the same LMXB contribution, but with 1.8 times higher contribution from the AGNs. The thick and thin curves in red represent the distribution of the S06 GCs and a de Vaucouleurs law characterizing the GC distribution derived by Rhode & Zepf (2004), both multiplied by a factor of 0.06. (b) Similar to panel (a), but for the vertical surface density distribution of field sources along the galaxy's minor axis. The source density is averaged within parallel slices of 10′ in width. North is positive.
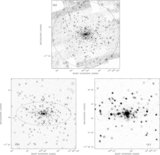
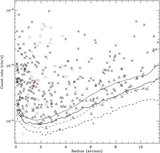
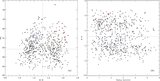
Other Images in This Article

Copyright and Terms & Conditions
© 2010. The American Astronomical Society. All rights reserved.