Image Details
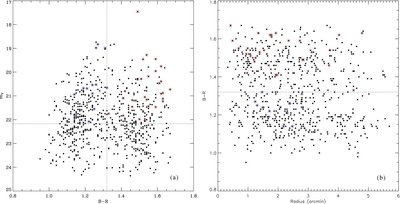
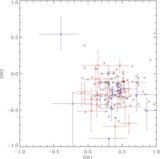
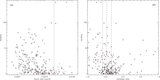
Caption: Figure 3.
(a) Color–magnitude diagram of all GCs identified in S06. Improved photometry is obtained from Spitler et al. (2008). GCs hosting a detected X-ray source are marked by an open circle. The vertical dashed line represents the division of blue ( B − R ⩽ 1.32) and red ( B − R > 1.3) GCs, the horizontal line represents the turnover magnitude, following S06. Also plotted is the metal-rich UCD (Hau et al. 2009), with m V = 17.46, which is found to host an X-ray source and marked by a red square. (b) GC color vs. galactocentric radius.
Other Images in This Article

Copyright and Terms & Conditions
© 2010. The American Astronomical Society. All rights reserved.
Copyright ©
2025 Astronomy Image Explorer. All Rights Reserved.