Image Details
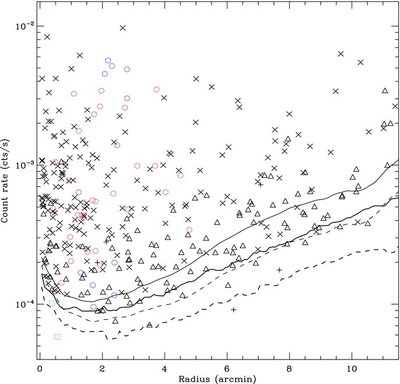
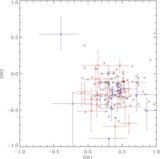
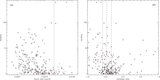
Caption: Figure 2.
0.4–6 keV ( F-band) count rate vs. galactocentric radius for the detected sources. Red circle: sources associated with red GCs; blue circle: sources associated with blue GCs; green square: sources not detected in the M and H2 bands; triangle: sources not detected in the S1 and H2 bands; plus: sources not detected in the S1 and M bands; cross: sources detected in at least three bands. The solid and dashed curves illustrate the detection threshold in the F band and M band, respectively, with the thin one showing the azimuthal average value and the thick one showing the minimum value at each radius.
Other Images in This Article

Copyright and Terms & Conditions
© 2010. The American Astronomical Society. All rights reserved.