Image Details
Caption: Figure 7.
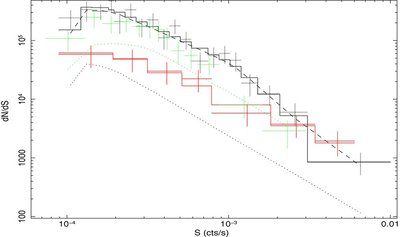
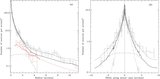
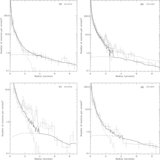
Differential NFR of field sources detected between 0
![]() 1 and 4′ (A1; black) and 4′–9′ (A2; green), and sources associated with GCs (red). The count rates are measured in the
F band (0.4–6 keV) for A1 sources and GC-LMXBs and in the
M band (0.7–2 keV) for A2 sources. Data points are adaptively grouped to have a minimum of six sources per bin. The black histogram
represents an acceptable fit to the A1 NFR, consisting of a broken power law for the galactic component (dashed curve) and
a cosmic component from Moretti et al. (dotted curve). The red histogram represents an acceptable power-law fit to the GC
NFR. The green dotted curve represents the expected cosmic component in the A2 NFR. Note the turnover of the NFRs and models
at low count rates, which results from the incompleteness and Eddington bias in the source detection.
1 and 4′ (A1; black) and 4′–9′ (A2; green), and sources associated with GCs (red). The count rates are measured in the
F band (0.4–6 keV) for A1 sources and GC-LMXBs and in the
M band (0.7–2 keV) for A2 sources. Data points are adaptively grouped to have a minimum of six sources per bin. The black histogram
represents an acceptable fit to the A1 NFR, consisting of a broken power law for the galactic component (dashed curve) and
a cosmic component from Moretti et al. (dotted curve). The red histogram represents an acceptable power-law fit to the GC
NFR. The green dotted curve represents the expected cosmic component in the A2 NFR. Note the turnover of the NFRs and models
at low count rates, which results from the incompleteness and Eddington bias in the source detection.
Other Images in This Article

Copyright and Terms & Conditions
© 2010. The American Astronomical Society. All rights reserved.