Image Details
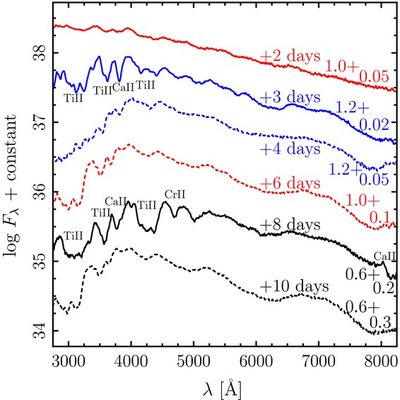
Caption: Figure 8.
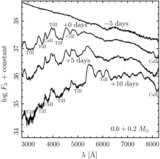
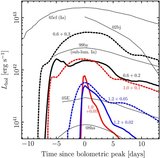
Optical spectra at B-band maximum for all models as labeled, with arbitrary offsets. Black, red, and blue lines are for 0.6, 1.0, and 1.2 M ☉ cores, respectively. Solid lines are for the lower envelope mass for each model, and dashed lines are for the higher envelope mass. Times shown are the ages since explosion.
Other Images in This Article
Copyright and Terms & Conditions
© 2010. The American Astronomical Society. All rights reserved.
Copyright ©
2025 Astronomy Image Explorer. All Rights Reserved.