Image Details
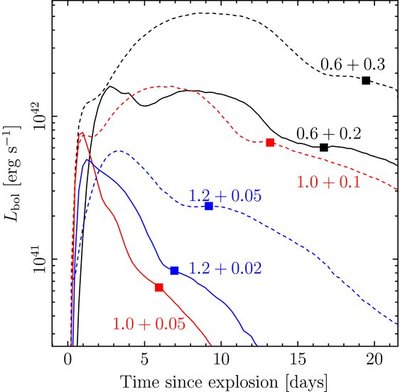
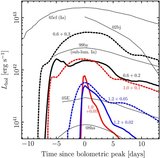
Caption: Figure 4.
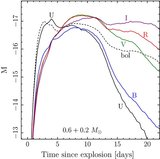
UVOIR bolometric luminosity vs. time since explosion for all models as labeled. Solid lines are for the lower envelope mass for each core, and dashed lines are for the higher envelope mass. Black, red, and blue lines are for core masses of 0.6, 1.0, and 1.2 M ☉, respectively. The multiple peaks are due to the stratification of radioactive isotopes in the ejecta. Squares denote the time after which over half of the gamma rays escape the ejecta without being absorbed.
Other Images in This Article
Copyright and Terms & Conditions
© 2010. The American Astronomical Society. All rights reserved.
Copyright ©
2025 Astronomy Image Explorer. All Rights Reserved.