Image Details
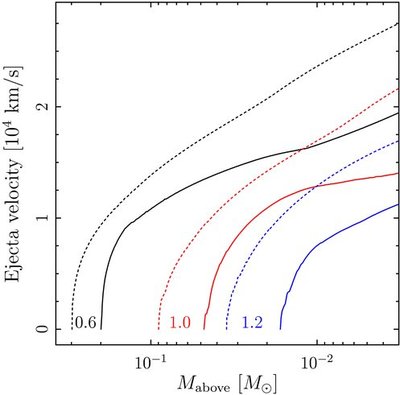
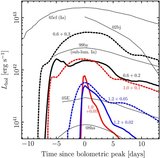
Caption: Figure 2.
Free-streaming ejecta velocity vs. mass above for all models: 0.6 + 0.2, 0.6 + 0.3, 1.0 + 0.05, 1.0 + 0.1, 1.2 + 0.02, and 1.2 + 0.05 M ☉. Core masses are as labeled; black, red, and blue lines are for core masses of 0.6, 1.0, and 1.2 M ☉, respectively. The solid lines are the smaller envelope masses for each model, and the dashed lines are the larger envelope masses. The velocities shown are calculated by taking the velocities 100 s after shock breakout and subtracting the effect of leaving the gravitational potential wells.
Other Images in This Article
Copyright and Terms & Conditions
© 2010. The American Astronomical Society. All rights reserved.
Copyright ©
2025 Astronomy Image Explorer. All Rights Reserved.