Image Details
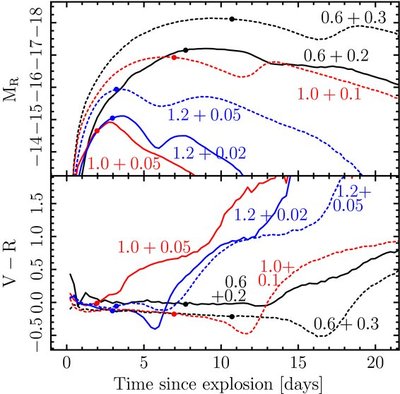
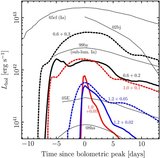
Caption: Figure 6.
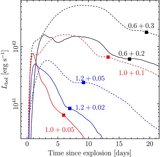
R-band light curves (top panel) and V − R colors (bottom panel) for all models as labeled. Solid lines show light curves and colors for the smaller envelope for each core mass, and dashed lines represent the larger envelopes. Black, red, and blue lines are for core masses of 0.6, 1.0, and 1.2 M ☉, respectively. Bullets denote the time of the B-band maximum for each model.
Other Images in This Article
Copyright and Terms & Conditions
© 2010. The American Astronomical Society. All rights reserved.
Copyright ©
2025 Astronomy Image Explorer. All Rights Reserved.