Image Details
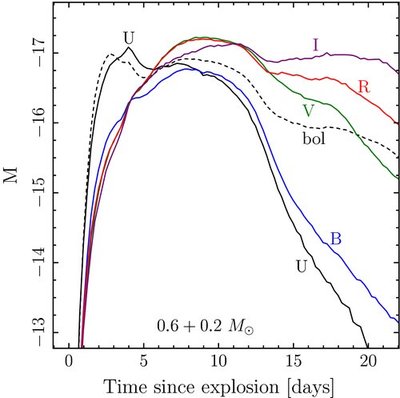
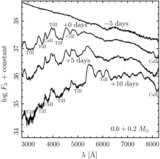
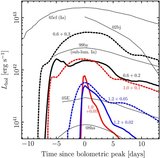
Caption: Figure 5.
Multiband light curves for the 0.6 + 0.2
M
☉ model in Vega magnitudes. The dashed line shows the bolometric light curve, and the solid lines show magnitudes for various
filters as labeled. The secondary peak in redder wavebands is apparent beginning
![]() 15 days after explosion, which is
15 days after explosion, which is
![]() 7 days after the time of
B-band maximum.
7 days after the time of
B-band maximum.
Other Images in This Article
Copyright and Terms & Conditions
© 2010. The American Astronomical Society. All rights reserved.
Copyright ©
2025 Astronomy Image Explorer. All Rights Reserved.