Image Details
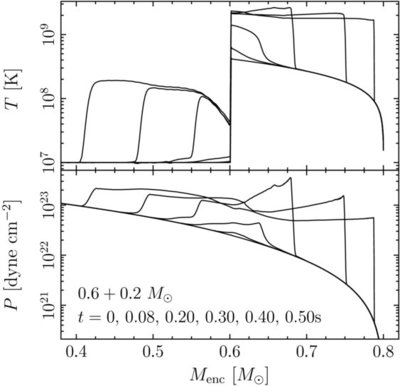
Caption: Figure 1.
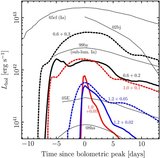
Snapshots of the temperature profile (top panel) and the pressure profile (bottom panel) of the 0.6 + 0.2 M ☉ model during its hydrodynamic evolution. Solid lines show the temperature and pressure vs. the enclosed mass at 0, 0.08, 0.2, 0.3, 0.4, and 0.5 s after the beginning of the hydrodynamic simulation when the temperature at the base of the envelope is perturbed upward by ~10%.
Other Images in This Article
Copyright and Terms & Conditions
© 2010. The American Astronomical Society. All rights reserved.
Copyright ©
2025 Astronomy Image Explorer. All Rights Reserved.