Image Details
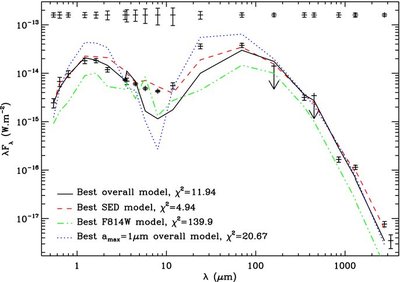
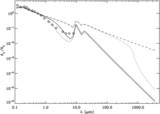
Caption: Figure 9.
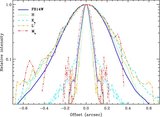
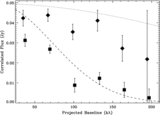
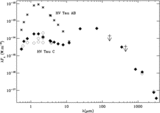
Comparison of the SED of HV Tau C (from Table 3, see also Figure 7) with various models: the best fit to all available data sets (black solid curve), the best fit to the SED alone (red dashed curve), the best fit to the F814W image (green dot-dashed curve), and the best overall fit with a max = 1 μm, i.e., interstellar-like dust properties (blue dotted curve). The thin error bars indicated at the top of the plot represent our Monte Carlo noise estimate. This noise is apparent in the jumps seen at 3 μm for the best overall model and at 6 μm for the best F814W fit.
Other Images in This Article
Copyright and Terms & Conditions
© 2010. The American Astronomical Society. All rights reserved.
Copyright ©
2025 Astronomy Image Explorer. All Rights Reserved.