Image Details
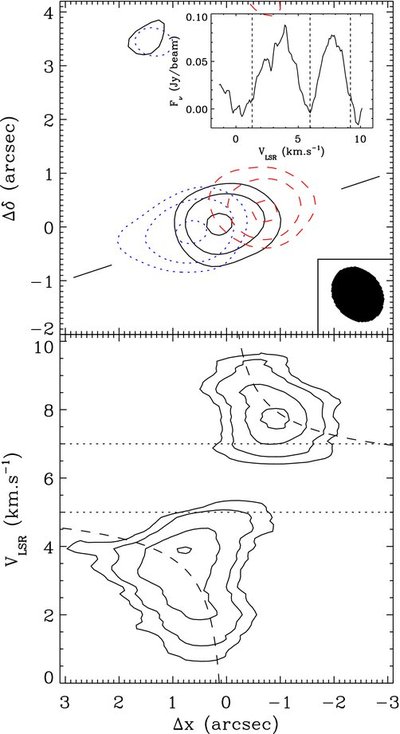
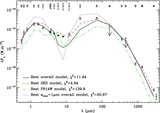
Caption: Figure 6.
Top: contour plots of the blue (dotted contours, 0.8–6 km s
−1 velocity range) and red (dashed contours, 6–9.5 km s
−1 velocity range) parts of the
12CO (2–1) line, superimposed on the contours of the adjacent 1.3 mm continuum (solid contours). Contours are drawn at 22.5%,
45%, and 90% of the peak intensity in each map. The reconstructed beam is shown for comparison. The origin of the relative
coordinates is at 04
h38
m35
![]() 51, +26°10′41
51, +26°10′41
![]() 5 (J2000), the nominal position of HV Tau C. The inset represents the integrated line profile. Bottom: position–velocity diagram
along the disk major axis (indicated by the two solid segments in the top panel). The three-dimensional datacube has been
smoothed using a 1 km s
−1×1'' running boxcar function. The contours in the position–velocity diagram are at 15%, 30%, 60%, and 90% of the peak intensity.
The dashed curve represents the theoretical Keplerian rotation curve for an 0.7
M
☉ star with
v
sys = 5.75 km s
−1. This is not meant as a fit but a reference to guide the eye. The dotted lines indicate the velocity range in which
13CO emission from the Taurus molecular cloud was observed by Mizuno et al. (1995) at the location of HV Tau.
5 (J2000), the nominal position of HV Tau C. The inset represents the integrated line profile. Bottom: position–velocity diagram
along the disk major axis (indicated by the two solid segments in the top panel). The three-dimensional datacube has been
smoothed using a 1 km s
−1×1'' running boxcar function. The contours in the position–velocity diagram are at 15%, 30%, 60%, and 90% of the peak intensity.
The dashed curve represents the theoretical Keplerian rotation curve for an 0.7
M
☉ star with
v
sys = 5.75 km s
−1. This is not meant as a fit but a reference to guide the eye. The dotted lines indicate the velocity range in which
13CO emission from the Taurus molecular cloud was observed by Mizuno et al. (1995) at the location of HV Tau.
Other Images in This Article
Copyright and Terms & Conditions
© 2010. The American Astronomical Society. All rights reserved.