Image Details
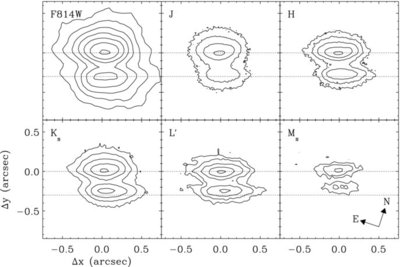
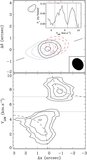
Caption: Figure 3.
Contour plots of HV Tau C after rotating all frames to a common orientation where the disk midplane is horizontal. The K s image is the VLT/NACO coronagraphic one and the L′ image is the Keck/NIRC2 LGS image. The contours lie from 90% of the peak and by decreasing factors of 2 from there. The L′ and M s images have been smoothed to improve their sensitivity (see Section 2.1.2 for more details). The dashed lines are guidelines indicating the location of the peak of each nebula in the F814W image.
Other Images in This Article
Copyright and Terms & Conditions
© 2010. The American Astronomical Society. All rights reserved.
Copyright ©
2025 Astronomy Image Explorer. All Rights Reserved.