Image Details
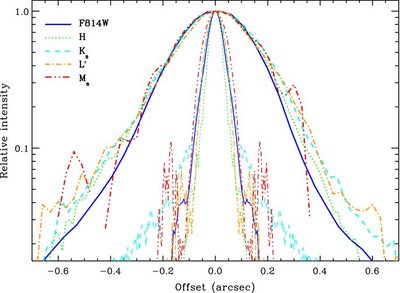
Caption: Figure 4.
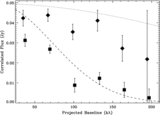
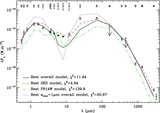
Lateral intensity profiles along the brightest (NE) nebula of HV Tau C. Profiles are drawn for the F814W (solid blue), H (dotted green), coronagraphic K s (dashed cyan), LGS L′ (dot-dashed orange), and M s (triple-dot-dashed red) images of the disk. All profiles are drawn normalizing the peak intensity in each image to unity. The thin curves represent the azimuthally-averaged profile of the PSF corresponding to each observation, using the same linestyles and color coding. The nebula is well resolved and its intensity profile is remarkably constant across the wavelength range probed here.
Other Images in This Article
Copyright and Terms & Conditions
© 2010. The American Astronomical Society. All rights reserved.