

Image Details
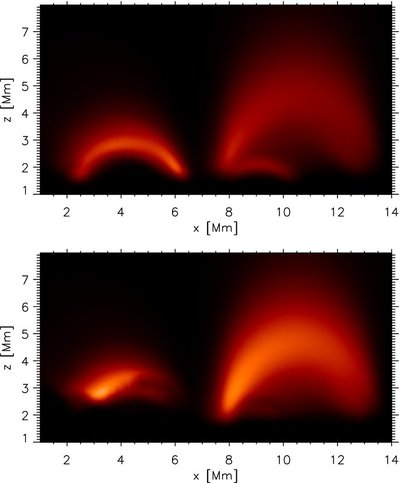
Caption: Figure 7.
Side views of synthetic Fe xii intensities from our 3D radiative MHD simulation. The intensity shown in each panel is summed along a ray parallel to the y-axis (perpendicular to the plane of the figure) using the density and temperature in the simulated box, and CHIANTI to calculate the emergent intensity. The top panel shows Fe xii 1242 Å emission, whereas the bottom panel shows Fe xii 195 Å emission. Note the significant differences between the intensities, both in the higher-lying loops (because of density sensitivity), and at the lower regions or footpoints of the loops ( z < 3 Mm) because of the absorption of EUV photons that have wavelengths below 912 Å. See the text for details.
Other Images in This Article
Copyright and Terms & Conditions
© 2009. The American Astronomical Society. All rights reserved.

