

Image Details
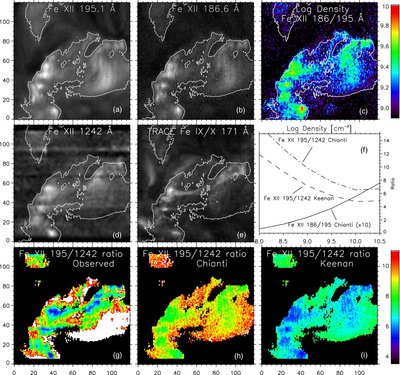
Caption: Figure 1.
Top row shows a spectroheliogram in Fe xii 195.1 Å and 186.88 Å taken on 2007 November 14 from 16:44 to 17:50 UTC with EIS, as well as the logarithm of the density as determined from the line ratio of the 186.88 and 195.1 Å lines. The middle row shows the slightly spatially smoothed SUMER raster taken from 17:12 through 20:33 UT and a TRACE Fe ix/x 171 Å image. The middle right panel shows the line ratio to density functions we used to determine the density for both line pairs. The Fe xii 186/195 Å line ratio is multiplied by 10 for illustration purposes. The bottom row shows the observed Fe xii 195/1242 Å line ratio, as well as the line ratio that is predicted if we use the density determination of the 186/195 line ratio, for two atomic models: CHIANTI and that of Keenan et al. (1990). The overplotted contours correspond to a brightness threshold in the EIS Fe xii 195.1 Å raster. See the text for details on the interpretation.
Other Images in This Article
Copyright and Terms & Conditions
© 2009. The American Astronomical Society. All rights reserved.

