

Image Details
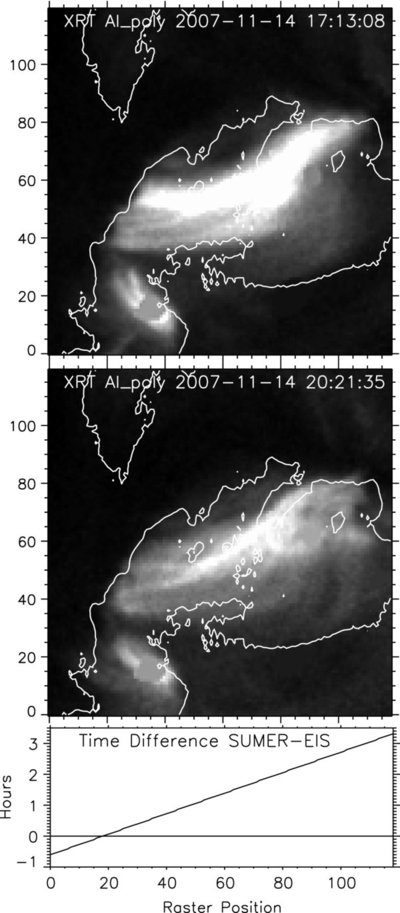
Caption: Figure 3.
Top two images show XRT images ( Al poly) taken at the beginning and end of the SUMER raster. The overplotted contours again correspond to the same brightness threshold in the EIS Fe xii 195 Å raster shown in Figure 1. Since the XRT filter is sensitive to hotter plasma than the Fe xii rasters, we see much more emission from the hot loops connecting the TR moss footpoints. In addition, we see that the loop structure in the middle right of the image drastically changes in morphology with new moss footpoints appearing around x = 80–120, y = 60. The lower panel shows, in hours, the time difference between the SUMER and EIS exposures (shown in Figure 1) at each co-aligned raster location. The time differences are caused by the different durations of the SUMER and EIS rasters, and the fact that they raster in E–W and W–E directions, respectively. The left part of the rasters is taken within 1 hr of each other, whereas the right part ( x>70) shows exposures that are taken 2 or more hours apart. See the text for details.
Other Images in This Article
Copyright and Terms & Conditions
© 2009. The American Astronomical Society. All rights reserved.

