

Image Details
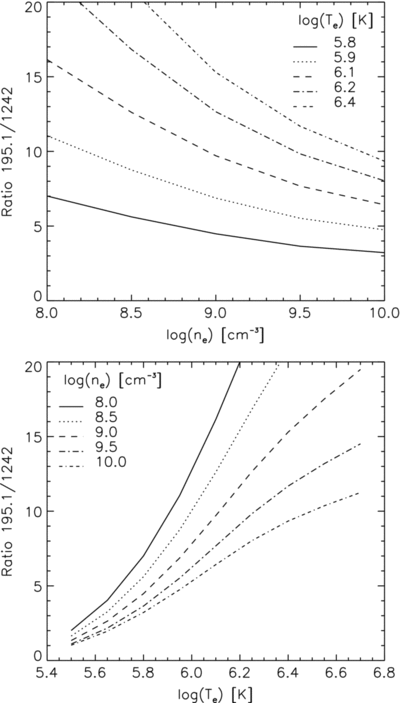
Caption: Figure 4.
Density sensitive intensity ratio of the Fe xii 195 Å and 1242 Å lines also varies depending on the temperature of the plasma (from the CHIANTI atomic database). The left plot shows the density sensitivity for a range of temperatures with log T from 5.8 to 6.4. The temperature associated with the maximum formation is log T = 6.15, with the contribution function dropping off steeply toward lower and higher temperatures. The right plot shows the same dependency, but now the ratio is plotted as a function of temperature for a range of densities. The densities in the active region studied vary between log n e = 9 and 10.
Other Images in This Article
Copyright and Terms & Conditions
© 2009. The American Astronomical Society. All rights reserved.

