Image Details
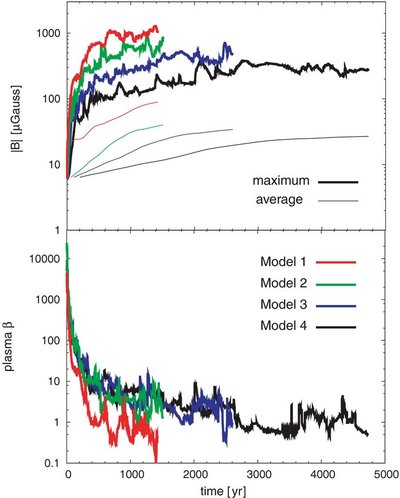
Caption: Figure 9.
Evolutions of the maximum (thick lines) and average (thin lines) field strengths (top), and the local plasma βs at the point where the magnetic field strength is maximum (bottom). The red, green, blue, and black lines are the results of Models 1, 2, 3, and 4, respectively.
Other Images in This Article
Copyright and Terms & Conditions
© 2009. The American Astronomical Society. All rights reserved.
Copyright ©
2026 Astronomy Image Explorer. All Rights Reserved.