Image Details
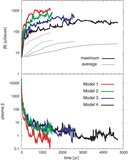
Caption: Figure 1.
Thermal equilibrium state of the cooling function (thick solid line). The isothermal lines of 10,000 K, 1000 K, and 100 K are plotted as dashed lines. The evolutionary track of diffuse WNM that is compressed by a shock wave and cooled by following radiative cooling to form thermally unstable gas is illustrated as allows. We also illustrate the evolutionary tracks of the thermal instability that are simulated in Stage 1. The initial unperturbed state of Stage 1 is plotted as a cross.
Other Images in This Article
Copyright and Terms & Conditions
© 2009. The American Astronomical Society. All rights reserved.
Copyright ©
2026 Astronomy Image Explorer. All Rights Reserved.