Image Details
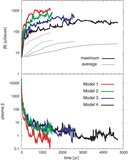
Caption: Figure 7.
Cross section profiles along the y-axis at x = 1.0 pc of Model 1 (solid) and x-axis at y = 1.0 pc of Model 2 (dotted). The number density, magnetic field strength, velocity component normal to the shock ( v y for Model 1 and v x for Model 2), and velocity component tangential to the shock ( v x for Model 1 and v y for Model 2) are plotted from the top to bottom panel. The shock front is located around position 1.85 pc (Model 1) and 1.90 pc (Model 2). The left and the right sides of these are downstream and upstream, respectively.
Other Images in This Article
Copyright and Terms & Conditions
© 2009. The American Astronomical Society. All rights reserved.