Image Details
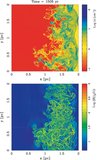
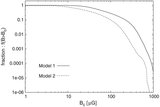
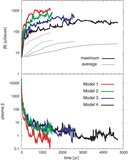
Caption: Figure 8.
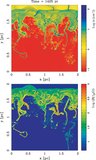
Power spectra of the velocity
v
2
k
(thick solid), magnetic field
B
2
k
/4π (dashed), and
 (dotted). The top panel shows the spectra in the region
x ∈ [0.75, 1.25] and
y ∈ [1.3, 1.8] of Model 1 at
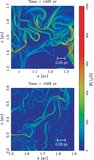
t = 1425 yr, and the bottom panel shows those in the region
x ∈ [1.3, 1.8] and
y ∈ [0.75, 1.25] of Model 2 at
t = 1508 yr. The thin solid lines show Kolmogorov spectra
v
2
k
∝
k
−(5/3)−(
D−1)
at
D = 2. The ratio of
B
2
k
/4π to
(dotted). The top panel shows the spectra in the region
x ∈ [0.75, 1.25] and
y ∈ [1.3, 1.8] of Model 1 at
t = 1425 yr, and the bottom panel shows those in the region
x ∈ [1.3, 1.8] and
y ∈ [0.75, 1.25] of Model 2 at
t = 1508 yr. The thin solid lines show Kolmogorov spectra
v
2
k
∝
k
−(5/3)−(
D−1)
at
D = 2. The ratio of
B
2
k
/4π to
 indicates the ratio of the magnetic to kinetic energies at scale
k.
indicates the ratio of the magnetic to kinetic energies at scale
k.
Other Images in This Article
Copyright and Terms & Conditions
© 2009. The American Astronomical Society. All rights reserved.