

Image Details
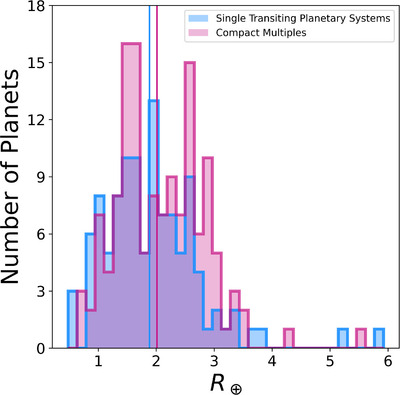
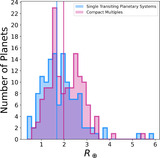
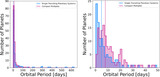
Caption: Figure 9.
Overlaid histograms of the planetary radius distributions for planets surviving the quality cut in single-transiting systems (blue) and compact multiple systems (pink) with radius values less than 6 R ⊕ and orbital periods greater than 1.5 days. We plot 110 single-transiting planets and 136 planets from compact multiple systems. The solid lines representing the median of the respective populations are located at 2.013 R ⊕ and 1.884 R ⊕ for compact multiple and single-transiting planets respectively. Table 18 contains the results from running a two-sample K-S test, Mann–Whitney U test, and Anderson–Darling k-sampling test on our reduced sample. We still obtain a significant Mann–Whitney U test p-value when making a period cutoff greater than 1.5 days in our sample.
Other Images in This Article
Copyright and Terms & Conditions
© 2024. The Author(s). Published by the American Astronomical Society.

