

Image Details
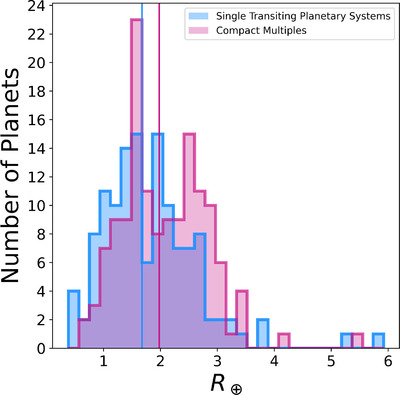
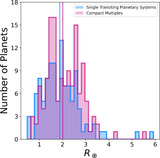
Caption: Figure 5.
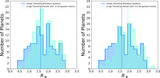
Overlaid histograms of the planetary radius distributions for planets in single-transiting systems with radius values less than 6 R ⊕ (blue) and compact multiple planets (pink) after performing a 95th percentile quality cut on both samples. The median of each sample is plotted as a vertical line of the same color. The median lines are off-shifted by 0.301 R ⊕. Our quality cut threw out 15 planets from our study that had σ Rp /R p > 0.2299. The two-sample K-S test, Mann–Whitney U test, and Anderson–Darling k-sampling test were reapplied to the planets surviving the quality cut. Tables 12 and 13 display the significance of our statistical tests that endured our jackknife resampling.
Other Images in This Article
Copyright and Terms & Conditions
© 2024. The Author(s). Published by the American Astronomical Society.

