

Image Details
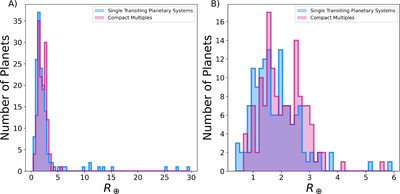
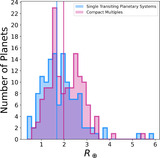
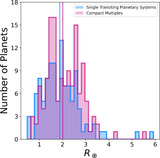
Caption: Figure 4.
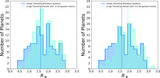
(A) Overlaid histograms of planetary radius distributions for planets in single-transiting systems (blue) and compact multiple planets (pink). (B) Overlaid histograms of planetary radius distributions for planets in single-transiting systems (blue) and compact multiple systems (pink) with radius values less than 6 R ⊕. We performed a two-sample K-S test, a Mann–Whitney U test, or Anderson–Darling k-sampling test for both the full planetary and consideration of only planets ≤6 R ⊕. In Tables 7 and 8 we present the results of the statistical tests, finding the radius distributions of single-transiting planets and planets in compact multiples to be significantly different in all statistical tests. Importantly, the test results become more significant (p < 0.0009) when only accounting for planets ≤6 R ⊕. The inclusion or exclusion of gas giant planets is not significant when assessing the radius distributions of these two samples.
Other Images in This Article
Copyright and Terms & Conditions
© 2024. The Author(s). Published by the American Astronomical Society.

