

Image Details
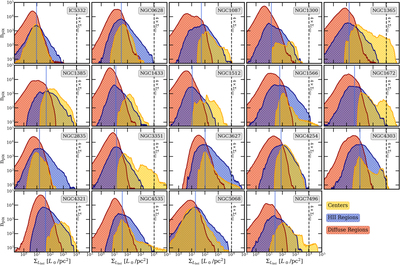
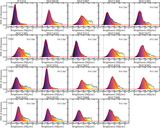
Caption: Figure 15.
Histograms of pixel-wise bolometric luminosity surface density ﹩{{\rm{\Sigma }}}_{{L}_{\mathrm{bol}}}﹩ from the center (yellow), diffuse component (red), and H II regions (blue) for each of our targets. The median ﹩{{\rm{\Sigma }}}_{{L}_{\mathrm{bol}}}﹩ for H II regions (vertical blue line) remains roughly consistent between targets. The vertical dashed line shows the estimated Eddington luminosity surface density in star-forming regions, scaled from ﹩{{ \mathcal F }}_{{L}_{\mathrm{bol}}}﹩ to ﹩{{\rm{\Sigma }}}_{{L}_{\mathrm{bol}}}﹩ units for direct comparison.
Other Images in This Article
Show More
Copyright and Terms & Conditions
© 2023. The Author(s). Published by the American Astronomical Society.

Copyright ©
2026 Astronomy Image Explorer. All Rights Reserved.
