

Image Details
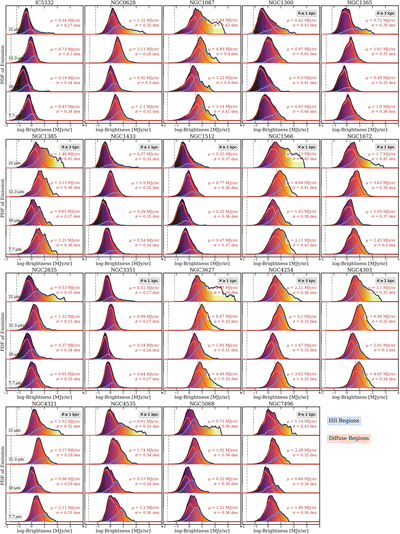
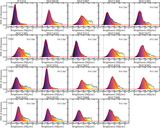
Caption: Figure 6.
The galactic disk PDFs (in black) of our full sample of 19 galaxies at 7.7, 10, 11.3, and 21 μm show an overall lognormal distribution with a power-law tail at higher intensities. The power law component can be primarily attributed to emission from individual H II regions (blue), and the lognormal component comes from emission from outside H II regions (red). Vertical dashed lines indicate the rms noise level in each filter for reference. The best-fit lognormal mean μ and dispersion σ are included for each PDF.
Other Images in This Article
Show More
Copyright and Terms & Conditions
© 2023. The Author(s). Published by the American Astronomical Society.

Copyright ©
2026 Astronomy Image Explorer. All Rights Reserved.
