

Image Details
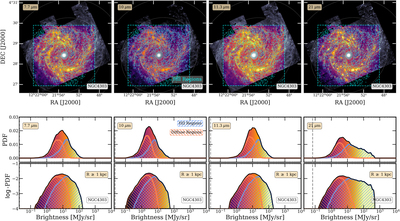
Caption: Figure 5.
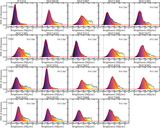
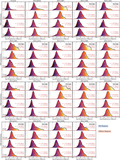
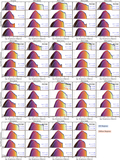
The PDFs of emission of the galactic disk (r ≥ 1 kpc) after masking the center, at 7.7, 10, 11.3, and 21 μm for NGC 4303, tagged by emission from within and outside of H II regions. Top: images of the galactic disk of NGC 4303 in each MIRI filter, with the masked central region shaded. Hα-identified H II regions are overlaid in blue contours. Middle: PDFs of inclination-corrected intensity from the disk (excluding the masked central region), colored by the intensity color bar used to display each image. The PDFs of emission from within H II regions and outside of H II region masks are included in hatched blue and orange, respectively. Bottom: the same disk-only PDFs shown in the middle row, but now with the y-axis in log-stretch to highlight the power-law tail. It is evident that the emission from H II regions builds up the power-law component, and the diffuse ISM outside of H II regions shows a lognormal PDF.
Other Images in This Article
Show More
Copyright and Terms & Conditions
© 2023. The Author(s). Published by the American Astronomical Society.

