

Image Details
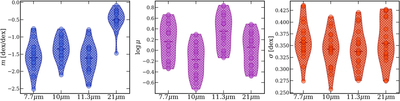
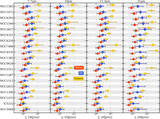
Caption: Figure 8.
Summary of the galactic disk PDF parameters at each wavelength, including the H II region power-law index (m) in the left panel and the diffuse component lognormal mean (μ) and variance (σ) in the middle and right panels, respectively, as included in Table 2. The PDFs at 21 μm show significantly more pronounced power law components, while the mean intensity of the diffuse lognormal component is systematically higher in PAH-tracing 7.7 and 11.3 μm. The lognormal PDF widths remain generally consistent across the four filters.
Other Images in This Article
Show More
Copyright and Terms & Conditions
© 2023. The Author(s). Published by the American Astronomical Society.

Copyright ©
2026 Astronomy Image Explorer. All Rights Reserved.
