

Image Details
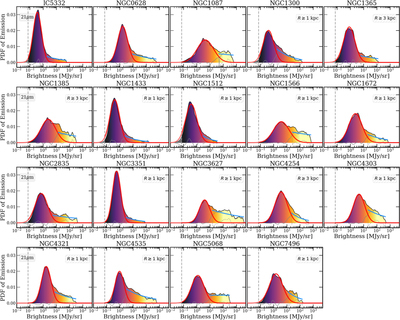
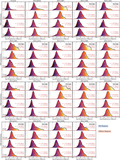
Caption: Figure 4.
The PDFs of the galactic disk (in black) for our full sample at 21 μm. Vertical dashed lines show the rms noise levels for 21 μm at 0.″85. The PDFs at each filter show an overall distribution well fit by a lognormal (red) at lower intensity (residuals in gray), with high-intensity residuals (dashed gray) that are well fit by a power law (blue).
Other Images in This Article
Show More
Copyright and Terms & Conditions
© 2023. The Author(s). Published by the American Astronomical Society.

Copyright ©
2026 Astronomy Image Explorer. All Rights Reserved.
