

Image Details
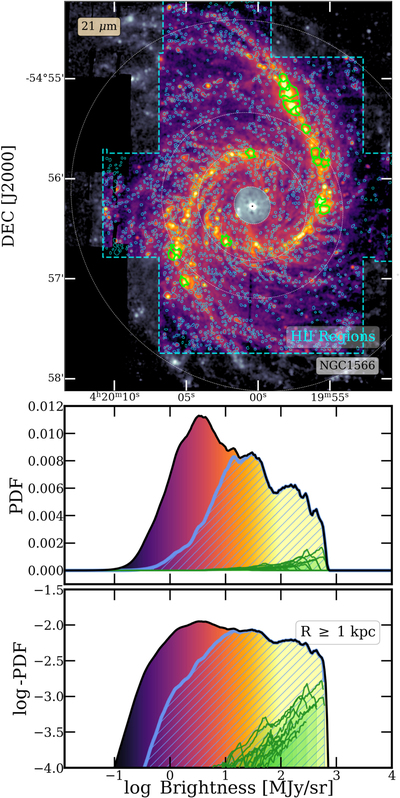
Caption: Figure 14.
NGC 1566 at 21 μm with all VLT/MUSE-identified H II regions outlined in blue (top), with the corresponding PDF (middle) and log-PDF in intensity (bottom). A few of the largest H II regions in NGC 1566 are highlighted in green. The overall pdf and log-PDF of intensities at 21 μm (black), from all H II regions (blue), and each of the highlighted individual H II regions (green) are shown for comparison.
Other Images in This Article
Show More
Copyright and Terms & Conditions
© 2023. The Author(s). Published by the American Astronomical Society.

Copyright ©
2026 Astronomy Image Explorer. All Rights Reserved.
