Image Details
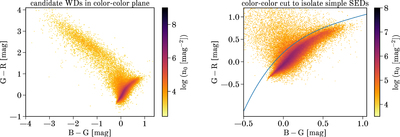
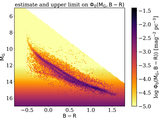
Caption: Figure 4.
Distribution of the candidate WD sample (after the astrometric fidelity cut) in the (B − G) vs. (G − R) color–color plane. The density distribution shows a sharp ridge where our objects of interest are located, objects with SEDs (or colors) of single WDs. The left panel shows the full color distribution, which exhibits a subset with an enormous spread in colors: most are presumably binaries, involving a WD (possibly with an accretion disk) and a low-mass star. The color cut, shown in the right panel as the blue line, eliminates most of those, while preserving ≥95% of spectroscopically confirmed WDs. This is an example of a sample selection cut that leaves the selection function for the objects of interest essentially unaffected. It simply makes the sample purer, lessening the need to explicitly model contamination.
Other Images in This Article


Copyright and Terms & Conditions
© 2021. The Author(s). Published by the American Astronomical Society.