Image Details
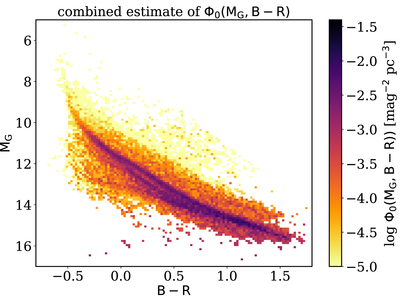
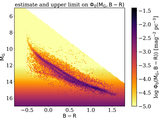
Caption: Figure 10.
Estimate of the WD luminosity–color density (LCF) from a combination of the previous estimates. The high-density regions were estimated using the ﹩{\overline{{\rm{S}}/{\rm{N}}}}_{\varpi ,\min }\gt 80﹩ sample to take full advantage of the precise parallaxes for the sharp features in the diagram. The other parts were estimated from the ﹩{\overline{{\rm{S}}/{\rm{N}}}}_{\varpi ,\min }\gt 20﹩ sample, and finally from the ﹩{\overline{{\rm{S}}/{\rm{N}}}}_{\varpi ,\min }\gt 5﹩ sample that had been calculated on a coarser grid; these latter two steps reduce sampling noise in the low-density parts of the distribution.
Other Images in This Article


Copyright and Terms & Conditions
© 2021. The Author(s). Published by the American Astronomical Society.