Image Details
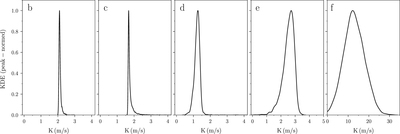
Caption: Figure 8.
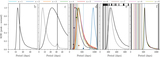
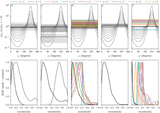
Distributions for the RV amplitude estimated from Equation (6) for each planet again going from “b” on the left to “f” on the right. All curves have been created using the period distributions in Figure 5 resulting from the parameters in Table 3.
Other Images in This Article

Copyright and Terms & Conditions
© 2019. The American Astronomical Society. All rights reserved.
Copyright ©
2025 Astronomy Image Explorer. All Rights Reserved.