Image Details
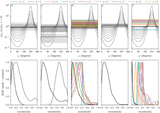
Caption: Figure 2.
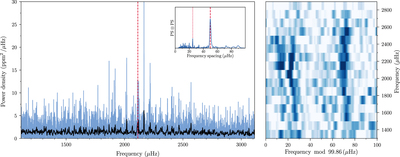
Power density spectrum (PDS; left) and échelle diagram (right) of HIP 41378. The black line shows a smoothed version of the PDS and the red dashed line indicates the value of ﹩{\nu }_{\max }﹩. The insert in the PDS shows the ﹩\mathrm{PS}\otimes \ \mathrm{PS}﹩ of a region centered on the measured ﹩{\nu }_{\max }﹩; the peak in the ﹩\mathrm{PS}\otimes \ \mathrm{PS}﹩ marked by a dashed red line gives the identified value for ﹩{\rm{\Delta }}\nu /2﹩, while the dotted line shows the value of ﹩{\rm{\Delta }}\nu /4﹩.
Other Images in This Article

Copyright and Terms & Conditions
© 2019. The American Astronomical Society. All rights reserved.
Copyright ©
2025 Astronomy Image Explorer. All Rights Reserved.