Image Details
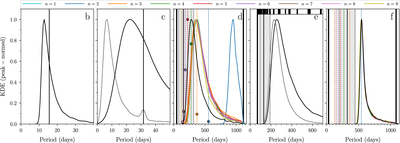
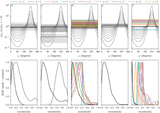
Caption: Figure 5.
Period distributions resulting from solving Equation (2) for all five planets going from “b” in the leftmost panel to “f” in the rightmost. The vertical black lines in the gray shaded areas mark the values from V16a. The thick black lines denote the minimum and maximum allowed value for the periods of “d,” “e,” and “f.” The black curves have been made using the parameters from the joint fit in Table 3. The gray curve for “c” has been created using parameters from a fit without constraints on ﹩\tfrac{a}{{R}_{\star }}﹩. The color coding for “d” and “f” refers to the assumed period when performing the individual fits to obtain values for the parameters entering in Equation (2) and the dashed vertical lines denote the period assuming a value for n. For “d” the markers indicate the relative posterior probabilities evaluated at the positions of the discrete periods after applying the normalized prior probabilities by Becker et al. (2019) (their Table 2). For “e” the horizontal bar in the top shows the allowed periods in white, whereas the black areas are the forbidden periods as these would have resulted in a transit in C18 or in sector 7 of TESS (see Figure 6); the gray line shows the period distribution after applying a prior on the period probability following Becker et al. (2019; their Equation (1)).
Other Images in This Article

Copyright and Terms & Conditions
© 2019. The American Astronomical Society. All rights reserved.