Image Details
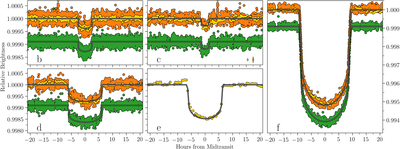
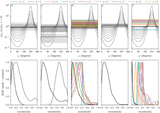
Caption: Figure 4.
Phased light curves for all five planets using the parameters in Table 3, and with the fitted model overplotted. Data from K2P2 are displayed in yellow, with C5 LC data given in light colors and C18 SC in dark. The data shown in green, and offset vertically from the yellow points, shows the C18 SC data from the K2SFF pipeline (Vanderburg & Johnson 2014)—the fitted model (applied to the yellow points) has been offset by the same amount for a more direct comparison. Planets “b” and “c” are displayed in the top panels and “d” and “e” are in the bottom panels. Shown to the right is planet “f.” Denoted in the panel for planet “c” are representative photometric uncertainties for the LC and SC data.
Other Images in This Article

Copyright and Terms & Conditions
© 2019. The American Astronomical Society. All rights reserved.