Image Details
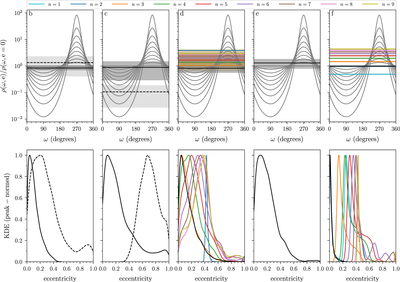
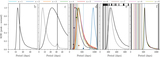
Caption: Figure 7.
Gray solid lines in the top panels display the curves governed by Equation (5). The horizontal line and corresponding shaded area is our result for a planet in a given configuration. The resulting eccentricity distributions are shown in the panel below. The black solid lines show our results using parameters from the parameters in Table 3 and the black dashed lines in “b” and “c” are the results obtained using the stellar parameters from V16a. As in Figure 5 the colored solid lines for “d” and “f” show the results from trying periods governed by Equation (3) and only fitting for these particular planets. Note that results for smaller periods (n > 9) are not displayed, since the ratio in Equation (5) was significantly different from 1, making it difficult to obtain reasonable eccentricity distributions when marginalizing over ω. The same is true for the n = 1 case for planet “d.”
Other Images in This Article

Copyright and Terms & Conditions
© 2019. The American Astronomical Society. All rights reserved.