Image Details
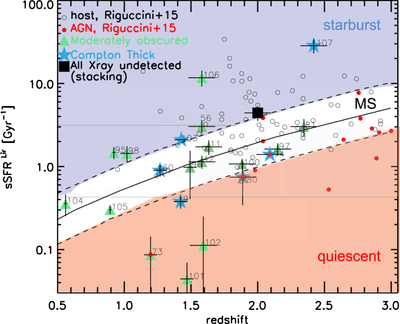
Caption: Figure 7.
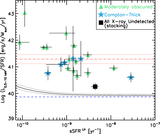
Redshift evolution of the specific SFR (sSFR = SFR/M*) detected in the infrared (black and red circles) and in X-rays (CT candidates: blue stars; heavily obscured AGNs: green triangles). The SFR rate is calculated from the infrared luminosity obtained from the SED-fitting procedure described by Riguccini et al. (2015), i.e., removing the AGN contribution. The solid line represents the star-forming main sequence from Elbaz et al. (2011), while the dashed lines are a factor 2 above and below this fit. Most of the CT AGN (blue stars) are within the MS. The upper part of the plot corresponds to the starburst regime while the lower part corresponds to the quiescent phase. The black rectangle shows the location of the X-ray undetected DOG population (i.e., the stacking analysis, see Section 3.3 for details) with respect to the MS.
Other Images in This Article
Copyright and Terms & Conditions
© 2019. The American Astronomical Society. All rights reserved.