Image Details
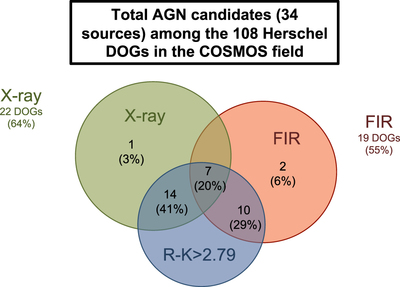
Caption: Figure 2.
Venn diagram showing the distribution of AGN selections within the DOG population detected with Herschel in the COSMOS field: X-ray selected AGN DOGs in green, FIR selected AGN DOGs (based on SED-fitting) in red and R − K cut in blue. The numbers and percentages are given with respect to the whole AGN population considered in this work (i.e., X-ray + FIR).
Other Images in This Article
Copyright and Terms & Conditions
© 2019. The American Astronomical Society. All rights reserved.
Copyright ©
2025 Astronomy Image Explorer. All Rights Reserved.