Image Details
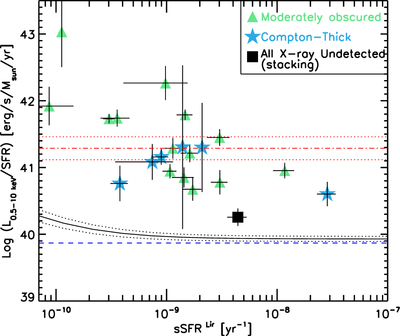
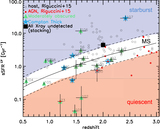
Caption: Figure 6.
Logarithm of the X-ray luminosity (0.5–10 keV) per unit SFR vs. sSFR for the 21 X-ray detected DOGs (CT candidates: blue stars; moderately obscured AGNs: green triangles) with FIR SED-decomposition fit. The black solid curve represents the best-fit solution from the results of Lehmer et al. (2016) for 116 X-ray detected normal galaxies and the two dotted lines show the error bars on this fit. The blue dashed line shows the results from Mineo et al. (2014) for z < 1.3 X-ray and radio detected galaxies. The red dotted–dashed line is the median value for the X-ray detected sources and we are showing the median error bars with the two red dotted lines. The black rectangle shows the logarithm of the X-ray luminosity (0.5–10 keV) per unit SFR vs. sSFR for the X-ray undetected sample (see Section 3.3).
Other Images in This Article
Copyright and Terms & Conditions
© 2019. The American Astronomical Society. All rights reserved.