Image Details
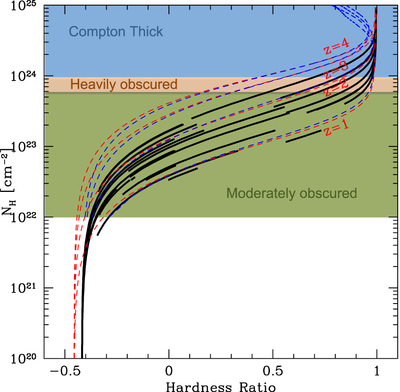
Caption: Figure 3.
Neutral hydrogen column density (NH) as a function of hardness ratio (HR) for the X-ray detected DOGs. The blue region (with NH > 1024 cm−2) represents the Compton-thick (CT) population, while the orange one shows the location of heavily obscured sources with NH ∼ 5 × 1023 cm−2 and the green region situated right below corresponds to the moderately obscured sources, with NH(cm−2) > 1022. The dashed lines show the expected relation between NH and HR for sources at z = 1, 2, 3, and 4 assuming an intrinsic power law plus photoelectric absorption (red lines) and the MYTorus models (blue lines). The black solid segments show the location for the sources in Table 2 considering the observed HR and their uncertainties and assuming the simple power-law model.
Other Images in This Article
Copyright and Terms & Conditions
© 2019. The American Astronomical Society. All rights reserved.