Image Details
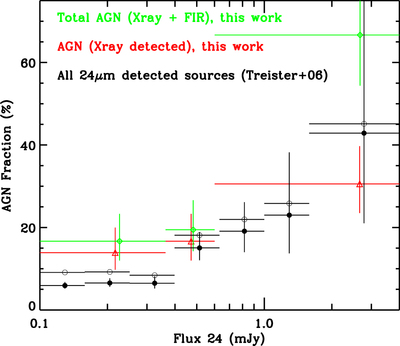
Caption: Figure 4.
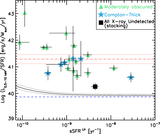
Fraction of Herschel-DOGs classified as AGNs as a function of 24 μm flux. The green diamonds show the combination of far-IR and X-ray selected AGNs, while the red triangles show only the X-ray selected AGNs. The horizontal error bars show the size of the flux bins, while vertical error bars show the 1σ Poissonian errors on the number of sources. As a comparison we show the fraction of sources classified as AGNs in the GOODS field (filled black circles) and the fraction corrected by the AGNs expected to be missed by X-ray selection, as estimated using an AGN population synthesis model (open black circles), as described by Treister et al. (2006).
Other Images in This Article
Copyright and Terms & Conditions
© 2019. The American Astronomical Society. All rights reserved.