Image Details
Caption: Figure 13.
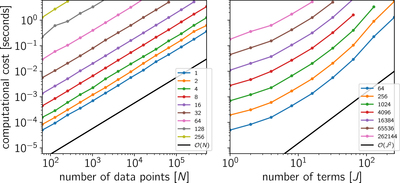
Same as Figure 3, but using an optimized C++ implementation of the Kalman filter method developed by Kelly et al. (2014). Comparing this figure to Figure 3, we see that celerite is about an order of magnitude faster in all cases. Left: cost of computing Equation (3) with a covariance matrix given by Equation (8) as a function of the number of data points N. The different lines show the cost for different numbers of terms J increasing from bottom to top. To guide the eye, the straight black line without points shows linear scaling in N. Right: same information plotted as a function of J for different values of N. Each line shows the scaling for a specific value of N increasing from bottom to top. The black line shows quadratic scaling in J.
Other Images in This Article
Show More
Copyright and Terms & Conditions
© 2017. The American Astronomical Society. All rights reserved.