Image Details
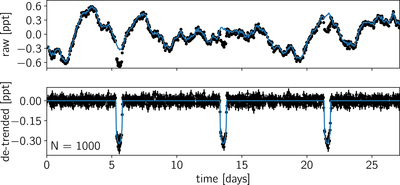
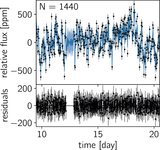
Caption: Figure 11.
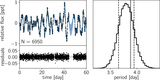
Top: month-long segment of the Kepler light curve for KIC 1430163 with a synthetic transit model injected (black points) and the MAP model for the stellar variability (blue line). Bottom: MAP “detrending” of the data in the top panel. In this panel, the MAP model for the stellar variability has been subtracted to leave only the transits. The detrended light curve is shown by black error bars, and the MAP transit model is shown as a blue line.
Other Images in This Article
Show More
Copyright and Terms & Conditions
© 2017. The American Astronomical Society. All rights reserved.
Copyright ©
2025 Astronomy Image Explorer. All Rights Reserved.