Image Details
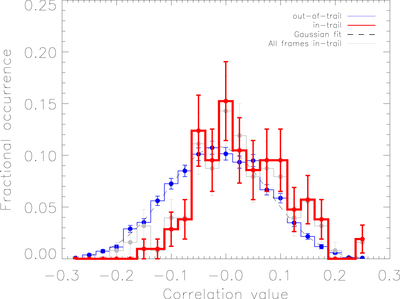
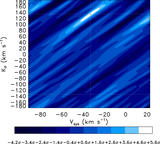
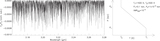
Caption: Figure 9.
Histogram showing the difference in aligned CCF distributions. The “in-trail” distribution corresponds to a 3 pixel wide column in the aligned CCF matrix positioned at ﹩{V}_{\mathrm{sys}}=-33﹩ km s−1, for ﹩{K}_{{\rm{P}}}=133﹩ km s−1, corresponding to the matrix in the upper-right panel of Figure 6. The “out-of-trail” distribution contains the remaining CCF values outside this column. The dashed line indicates that the out-of-trail CCFs follow a Gaussian distribution. There is a noticeable difference in the mean of the in- and out-of-trail distributions, which is quantified by the T-test in Figure 8. The gray line shows the in-trail distribution when including the degraded data frames (see Section 2.3). Note how the gray bins are noticeably lower than the red bins for positive correlation values and vice versa for the negative bins. The inclusion of these frames in the cross-correlation analysis causes a reduction of more than ﹩1\sigma ﹩ in the difference between the means of the in- and out-of-trail distributions. We adopt the red in-trail distribution (i.e., with the degraded frames removed) for the remainder of our analysis.
Other Images in This Article

Show More
Copyright and Terms & Conditions
© 2017. The American Astronomical Society. All rights reserved.