Image Details
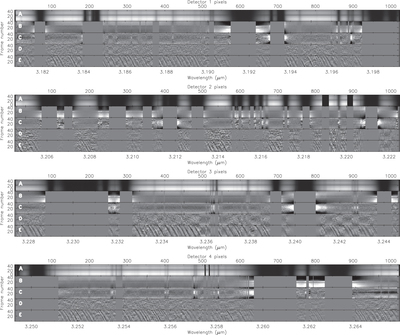
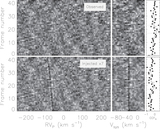
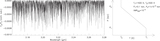
Caption: Figure 2.
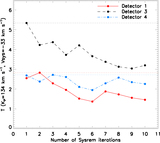
Spectra at different stages of the telluric removal process for each CRIRES detector. The x-axes correspond to wavelength i.e., pixel number, and the y-axes are ordered in time i.e., frame number. Detector 2 is not used in our analysis but it shown here for completeness. The sub-panels are as follows. Panel (A): the spectra extracted from the CRIRES pipeline, with bad pixels corrected, and aligned to match the telluric features of the highest S/N spectrum. The dark horizontal bands contain spectra taken under poor seeing. The broad dark vertical bands are saturated telluric lines. Panel (B): as in A, but normalized and with the mean of each column subtracted from itself. The solid gray regions mark regions of saturated telluric features which are excluded from our cross-correlation analysis (see Section 3.2). Panel (C): the residuals remaining after one iteration of SYSREM on the spectra. Note that the non-saturated telluric and stellar features e.g., at pixel 420 on detector 1 still remain. Panel (D): the residuals after applying the adopted number of iterations of SYSREM for the detector, the high-pass filter, and dividing each column by its variance. The telluric features have been sufficiently removed, leaving behind the planet spectrum buried in the noise. Panel (E): the same as (D), but with a best-matching model planet spectrum from Section 3.2 injected at the expected Doppler shift of 51 Peg b at a factor of 100 times greater than its nominal value before running SYSREM. This is to highlight the many individual strong water lines in the planet spectrum whose signal will be combined with the cross-correlation procedure detailed in Section 3.2. The authors are happy to supply the processed spectral matrices upon request.
Other Images in This Article

Show More
Copyright and Terms & Conditions
© 2017. The American Astronomical Society. All rights reserved.