Image Details
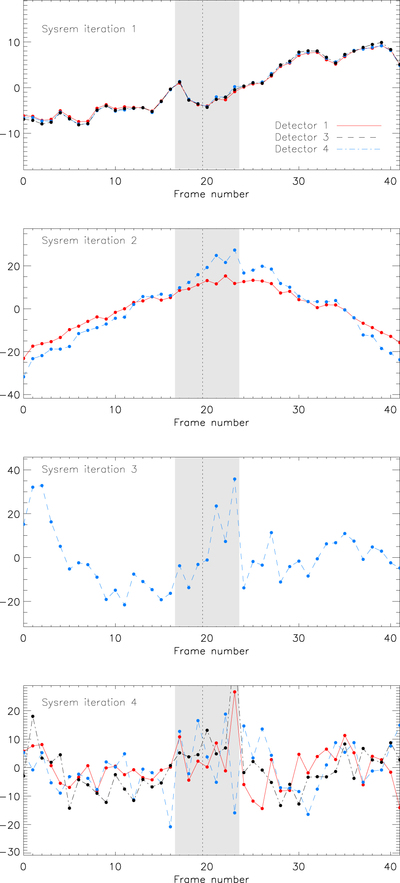
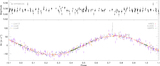
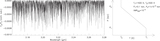
Caption: Figure 4.
The trend identified and removed from each column by SYSREM for each detector. Although it is not used in our final data analysis, the fourth SYSREM iteration for all detectors is shown in the bottom panel. Its purpose here is to highlight the overall relative flatness of the removed trend, except in the gray vertical regions which bound spectra that are later excluded from the analysis of the planetary signal (see Section 3.4). These spectra occurred during a period of poor and unsettled seeing (see Figure 5). The vertical dashed line marks when the exposure time was increased from 20 to 30 s.
Other Images in This Article

Show More
Copyright and Terms & Conditions
© 2017. The American Astronomical Society. All rights reserved.
Copyright ©
2025 Astronomy Image Explorer. All Rights Reserved.