Image Details
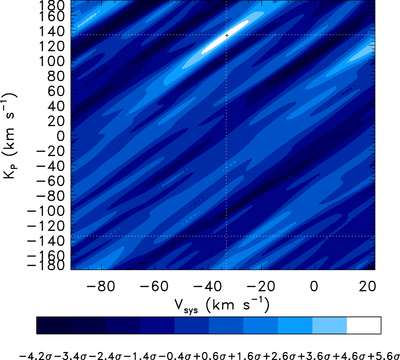
Caption: Figure 8.
Significance values derived from the T-test for the best-matching template. The black plus sign marks the peak significance, ﹩5.6\sigma ﹩, located at ﹩{V}_{\mathrm{sys}}=-33\pm 2﹩ km s−1 and ﹩{K}_{{\rm{P}}}={133}_{-3.5}^{+4.3}﹩ km s−1, where the errors are the maximal extent of the white 1σ error contour. The dashed white lines mark the known systemic velocity (﹩{V}_{\mathrm{sys}}=-33.25﹩ km s−1), and the tentative reported value of ﹩{K}_{{\rm{P}}}=134.1\pm 1.8﹩ km s−1 by Brogi et al. (2013). The peak significance and its ﹩1\sigma ﹩ error contour are coincident with these literature values. A dashed white horizontal line at ﹩{K}_{{\rm{p}}}=-134.1﹩ km s−1 highlights that there is no matching signal in negative velocity space, acting as an additional sanity check against spurious signals.
Other Images in This Article

Show More
Copyright and Terms & Conditions
© 2017. The American Astronomical Society. All rights reserved.